Card Impact Analytics: What Win Δ and Play % Mean
Every deck on SnapComplete has a premium panel that grades it card by card. Tap the eyeball row under any deck on the Decks page or your own My Decks to expand a ranked list of all twelve cards. The Win Δ and Play % buttons toggle two views: how the deck's winrate differed depending on whether each card was drawn, and how often you played each card once you drew it.
Win Δ: Winrate When a Card Is Drawn vs Not Drawn
Win Δ compares two winrates: how often the deck won in games where you drew the card, against how often it won in games where you did not. It is shown in percentage points (pp). It has nothing to do with when in the game you draw the card, only whether the card was drawn at all.
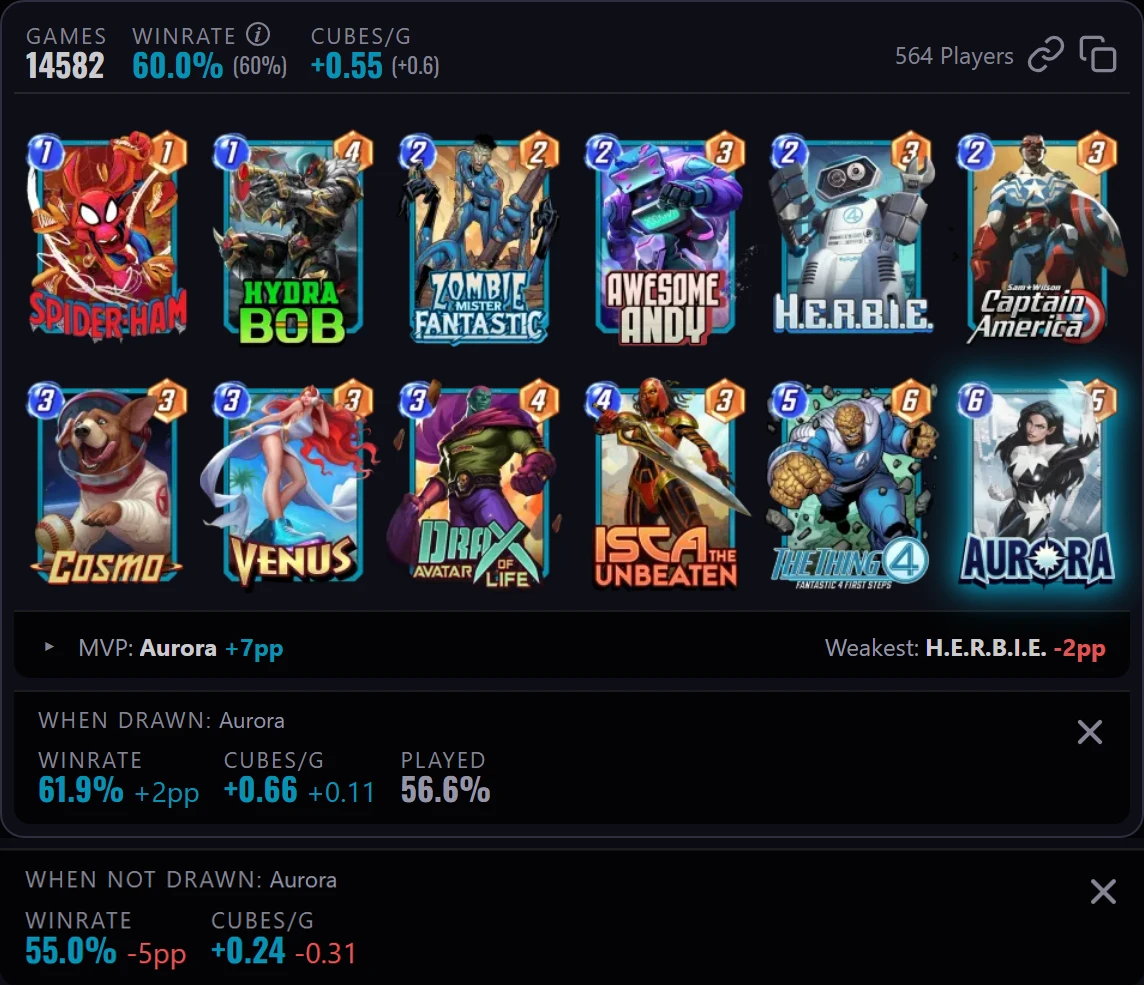
A positive number means the deck won more often in the games where that card was drawn. A negative number means it won more often in the games where that card stayed in the deck. The top card is labeled MVP, the bottom Weakest, and the collapsed panel shows just those two.
Take Aurora in the deck below, at +7pp: this deck won 61.9 percent of its games when she was drawn and 55.0 percent when she was not, a 7 point gap that ranked her MVP. A card near 0pp won about the same whether or not it was drawn. Big gaps show up most on your own My Decks, where the numbers are raw and a small sample lets one card swing the winrate a lot.
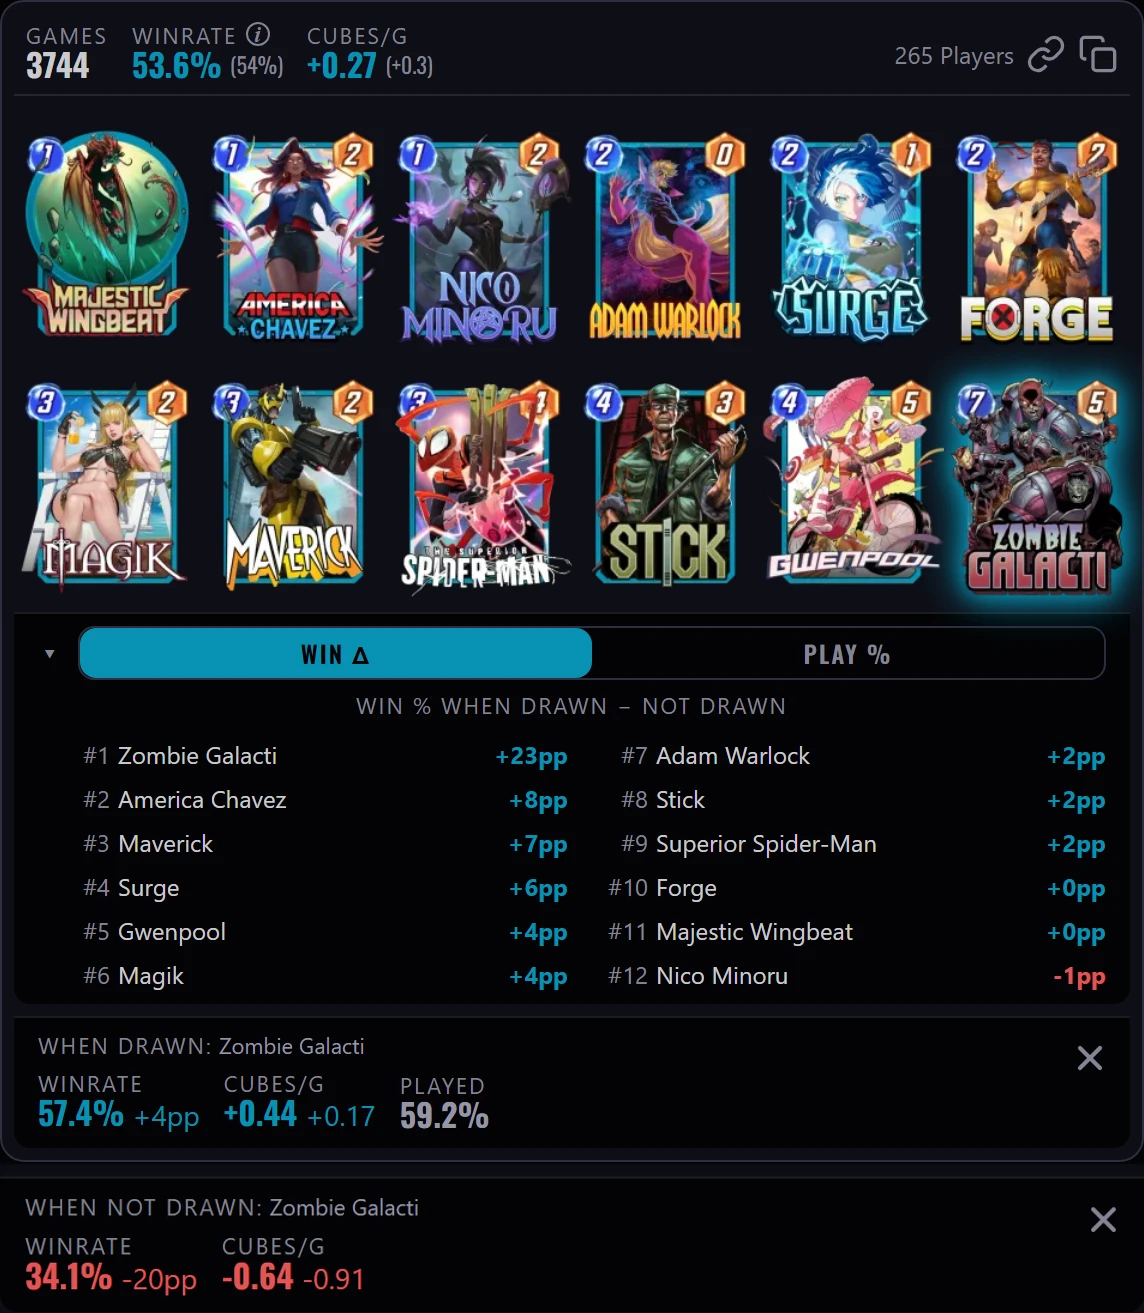
Two things to keep in mind. Win Δ is winrate only: the panel also shows each card's cube rate, but cubes never feed the ranking. And the bigger the gap, the more the deck's record swung on whether that card was drawn. Zombie Galacti is a good example: in the deck below it topped the list at +23pp, far above every other card, with the deck winning 57.4 percent of the games where Galacti was drawn and only 34% (57% - 23pp) in the games where it was not.
Win Δ Is Smoothed on the Leaderboard, Raw on Your Own Decks
On the community Decks page, each side of the Win Δ is pulled toward the deck's overall winrate based on sample size. A card drawn in only a few games cannot post a wild swing, the same sample-size protection used across the leaderboard. It is the Bayesian smoothing you see everywhere else on the site.
Your own My Decks shows Win Δ raw: the exact gap from your games, no shrinkage, however few games that is. So a card can read a little stronger or weaker on the leaderboard than on your personal stats, and that gap is the smoothing at work.
Play %: How Often You Play a Card Once You Draw It
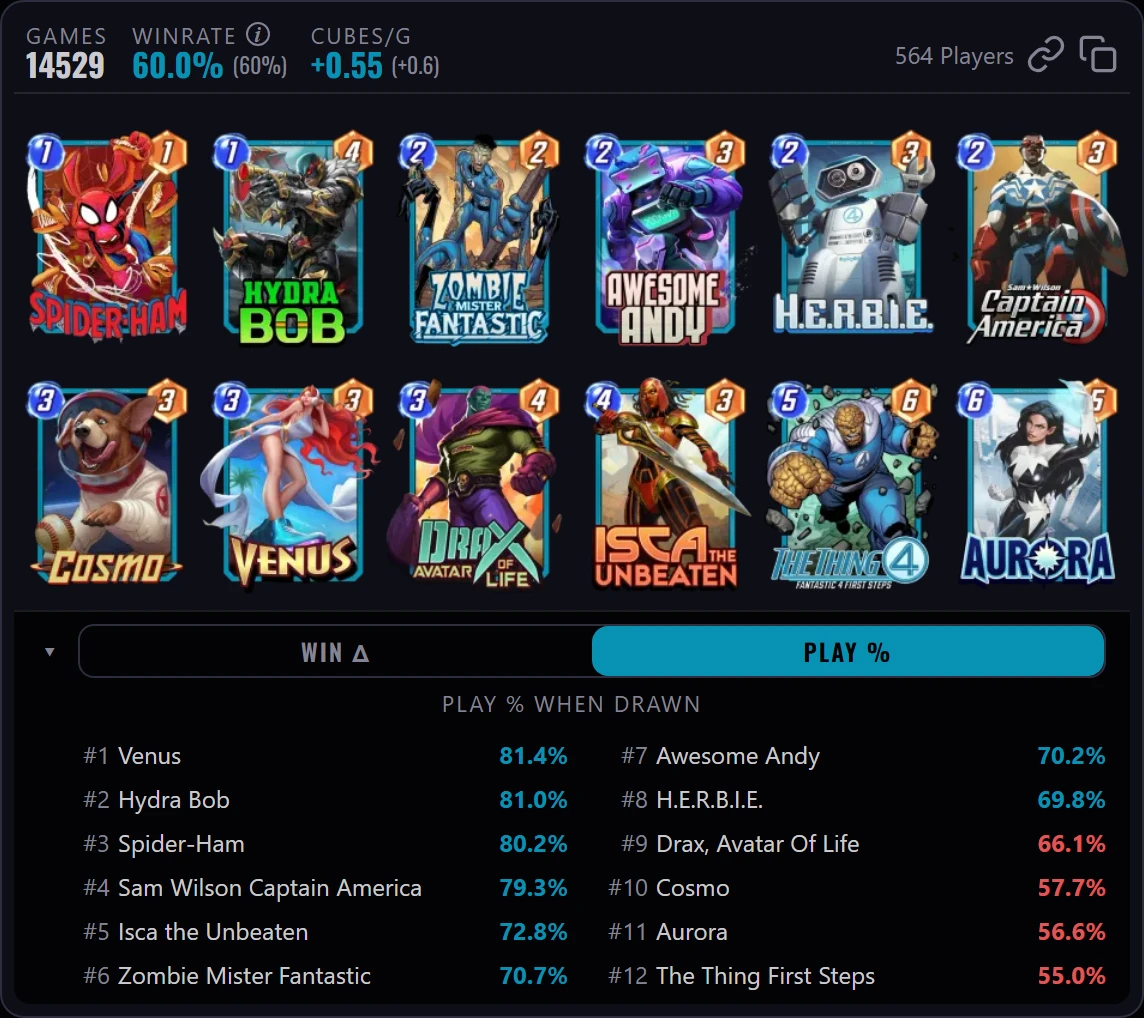
Play % is simpler. Of the games where you drew the card, how often did you actually play it? No smoothing on either page. The card you played almost every time you drew it sits at the top as Most; at the bottom, Least, is the card you most often kept in hand instead. A card turns cyan once you played it in at least two of every three draws.
Both views are premium, on every deck on the site and every deck of your own.